ECMWF IFS ENS forecast, 15 day, 0.25 degree validation report
This dataset validation report plots a sample of values from the ECMWF IFS ENS forecast, 15 day, 0.25 degree dataset over time and across space, comparing where possible to a previously validated reference dataset. It also reports the quantity of missing values and their associated timestamps. These analyses are one layer of a multi-layered dataset validation process we perform at dynamical.org and also provide users a preview of the dataset contents.
Report generation start time: 2026-05-16T02:04:22 UTC
Summary
What looks good
- Geometry and coordinates are correct on every variable. North at top, east on right, longitude in [-180, +180), coastlines and continents at expected locations. Verified across all 19 variables.
- All values are physically plausible and unit conventions correct. Spot checks: temperature_2m globally -55 to +45 °C; surface pressure 48-106 kPa (low at Himalayas/Andes); MSL pressure 95-105 kPa; 10m wind up to ~29 m/s; wind gust up to 43 m/s; precipitation rate 0-0.012 kg m⁻² s⁻¹; SW radiation 0-1030 W m⁻²; LW radiation 75-468 W m⁻²; geopotential heights match expected magnitudes at each pressure level (~5500m at 500hPa, ~1400m at 850hPa, ~700m at 925hPa).
- Histograms align well with the reference for every shared variable (temperature_2m, pressure_surface, pressure_reduced_to_mean_sea_level, precipitation_surface, both SW and LW radiation, both wind u and v at 10m and 100m, geopotential_height_500hpa).
- Diurnal cycles are in phase with the reference (SW radiation peaks at the same UTC times at both points — no time-coordinate or UTC/local bug).
- All nulls are explained:
categorical_precipitation_type_surfaceandwind_gust_10m: structurally null before 2024-11-13, matchingdate_available.total_cloud_cover_atmosphere: structurally null before 2025-11-21, matchingdate_available.- All other variables: zero nulls across the full archive.
- No quantization banding, no sentinel values, no flipped maps, no flatlines or spurious spikes observed in any per-variable plot.
- Accumulated/averaged variables (precipitation, both radiations, wind_gust) correctly omit the analysis-step NaN from null counts.
Datasets
| Role | Name | ID | Version | URL |
|---|---|---|---|---|
| Validation | ECMWF IFS ENS forecast, 15 day, 0.25 degree | ecmwf-ifs-ens-forecast-15-day-0-25-degree |
v0.1.0 |
s3://us-west-2.opendata.source.coop/dynamical/ecmwf-ifs-ens-forecast-15-day-0-25-degree/v0.1.0.zarr |
| Reference | NOAA GEFS analysis | noaa-gefs-analysis |
0.1.2 |
s3://us-west-2.opendata.source.coop/dynamical/noaa-gefs-analysis/v0.1.2.zarr |
Run parameters
- Validation dataset type: forecast
- Validation time range: init_time 2024-04-01T00:00 → 2026-05-15T00:00
- Reference time range: time 2000-01-01T00:00 → 2026-05-15T18:00
- Time scope: full dataset
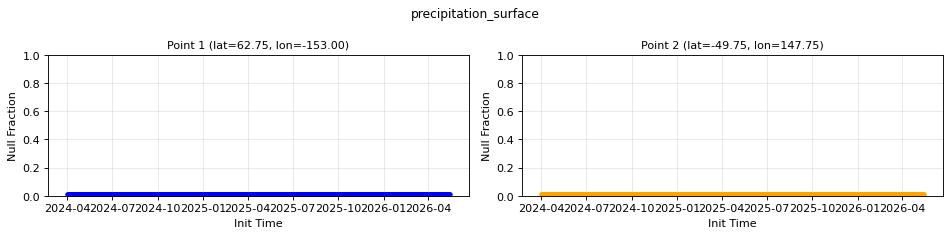
Missing values
- Point 1: lat=62.7500, lon=-153.0000
- Point 2: lat=-49.7500, lon=147.7500
Spatial and distribution
- Spatial comparison time: init=2025-03-05T00:00, lead=3h (reference at 2025-03-05T03:00)
- Ensemble member: 46
Time series
- Point 1: lat=62.7500, lon=-153.0000
- Point 2: lat=-49.7500, lon=147.7500
- Timeseries period: Forecast init_time: 2026-03-27T00:00
- Ensemble member: 46
Combined plots
All variables combined into a single plot for each type of analysis.
- Missing values:
combined_nulls.png - Spatial and distributions:
combined_spatial.png - Time series:
combined_temporal.png
Missing timestamps
Full list: missing_timestamps.txt
| Variable | Point | Missing count | Total count | Missing % |
|---|---|---|---|---|
categorical_precipitation_type_surface |
P1 | 226 | 3359625 | 0.01% |
categorical_precipitation_type_surface |
P2 | 226 | 3359625 | 0.01% |
total_cloud_cover_atmosphere |
P1 | 599 | 3359625 | 0.02% |
total_cloud_cover_atmosphere |
P2 | 599 | 3359625 | 0.02% |
wind_gust_10m |
P1 | 226 | 3320100 | 0.01% |
wind_gust_10m |
P2 | 226 | 3320100 | 0.01% |
Per-variable details
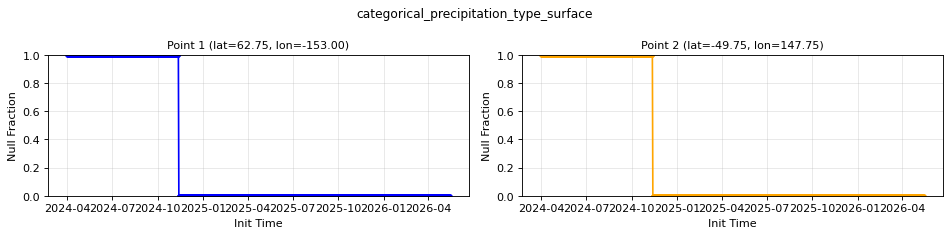
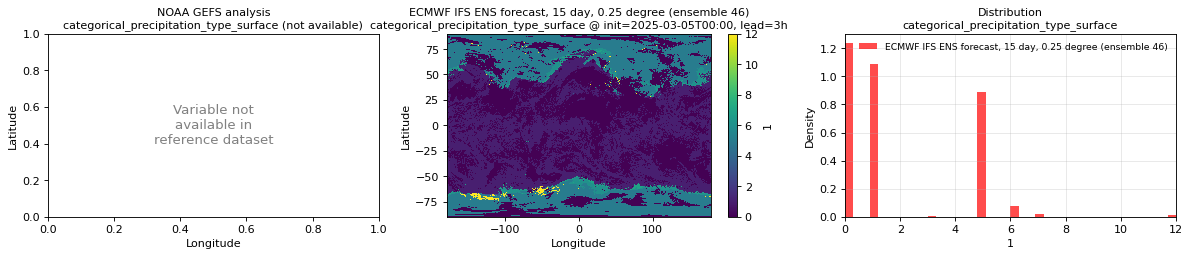
categorical_precipitation_type_surface
Metadata
- units:
1 - long_name: Precipitation type
- short_name: ptype
- standard_name: n/a
- step_type: instant
Spatial comparison
- plot:
spatial_categorical_precipitation_type_surface.png - time: init=2025-03-05T00:00, lead=3h (reference at 2025-03-05T03:00)
- validation: min=0, mean=1.899, max=12
- reference: variable not available in reference dataset
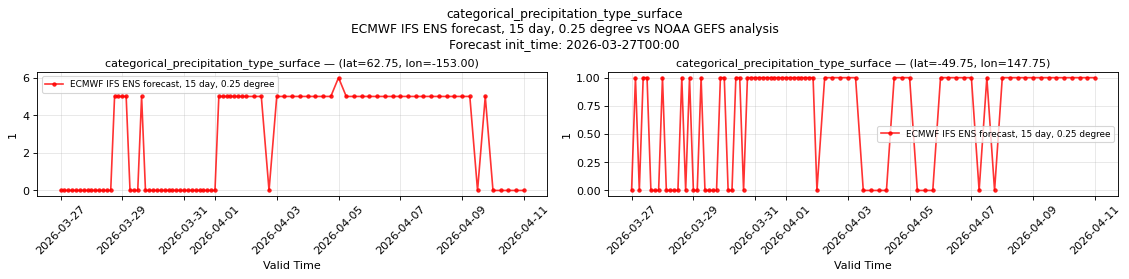
Temporal comparison
- plot:
temporal_categorical_precipitation_type_surface.png - period: Forecast init_time: 2026-03-27T00:00
P1 (lat=62.75, lon=-153.00):
- validation: min=0, mean=2.482, max=6
- reference: variable not available in reference dataset
P2 (lat=-49.75, lon=147.75):
- validation: min=0, mean=0.6588, max=1
- reference: variable not available in reference dataset
Nulls
- P1 nulls: 979710/3359625 — 226 missing (first: 2024-04-01T00:00:00, 2024-04-02T00:00:00, 2024-04-03T00:00:00 … last: 2024-11-10T00:00:00, 2024-11-11T00:00:00, 2024-11-12T00:00:00)
- P2 nulls: 979710/3359625 — 226 missing (first: 2024-04-01T00:00:00, 2024-04-02T00:00:00, 2024-04-03T00:00:00 … last: 2024-11-10T00:00:00, 2024-11-11T00:00:00, 2024-11-12T00:00:00)
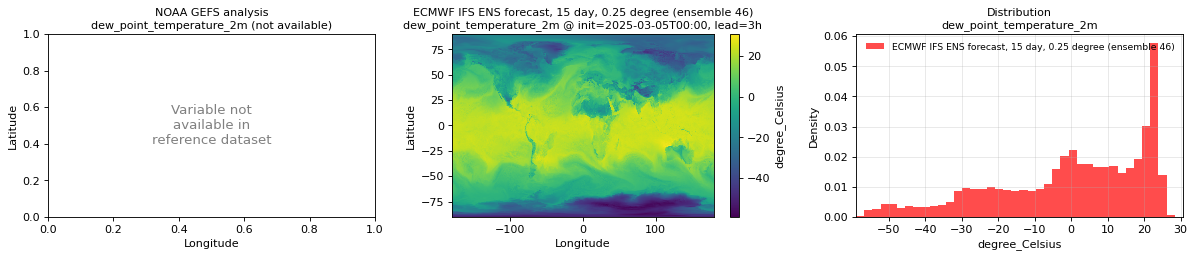
dew_point_temperature_2m
Metadata
- units:
degree_Celsius - long_name: 2 metre dewpoint temperature
- short_name: 2d
- standard_name: dew_point_temperature
- step_type: instant
Spatial comparison
- plot:
spatial_dew_point_temperature_2m.png - time: init=2025-03-05T00:00, lead=3h (reference at 2025-03-05T03:00)
- validation: min=-59, mean=-0.3165, max=30.62
- reference: variable not available in reference dataset
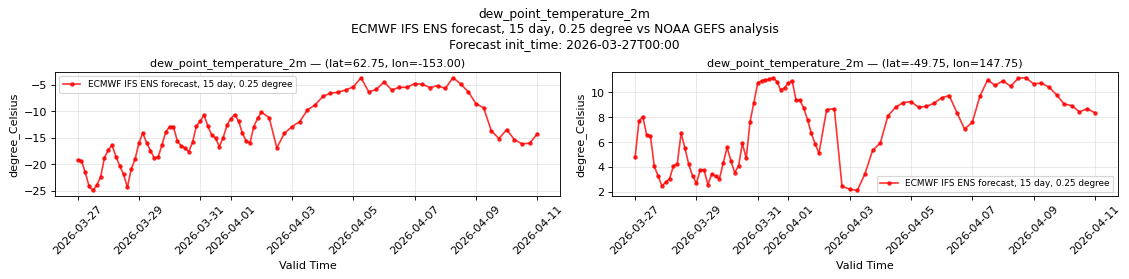
Temporal comparison
- plot:
temporal_dew_point_temperature_2m.png - period: Forecast init_time: 2026-03-27T00:00
P1 (lat=62.75, lon=-153.00):
- validation: min=-24.88, mean=-13.23, max=-3.688
- reference: variable not available in reference dataset
P2 (lat=-49.75, lon=147.75):
- validation: min=2.125, mean=7.227, max=11.19
- reference: variable not available in reference dataset
Nulls
- P1 nulls: 0/3359625 — none
- P2 nulls: 0/3359625 — none

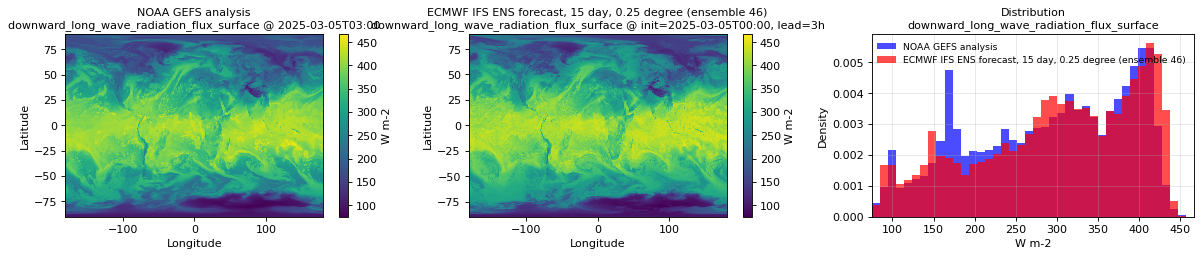
downward_long_wave_radiation_flux_surface
Metadata
- units:
W m-2 - long_name: Surface downward long-wave radiation flux
- short_name: sdlwrf
- standard_name: surface_downwelling_longwave_flux_in_air
- step_type: avg
Spatial comparison
- plot:
spatial_downward_long_wave_radiation_flux_surface.png - time: init=2025-03-05T00:00, lead=3h (reference at 2025-03-05T03:00)
- validation: min=75, mean=299.1, max=468
- reference: min=76, mean=289.4, max=466
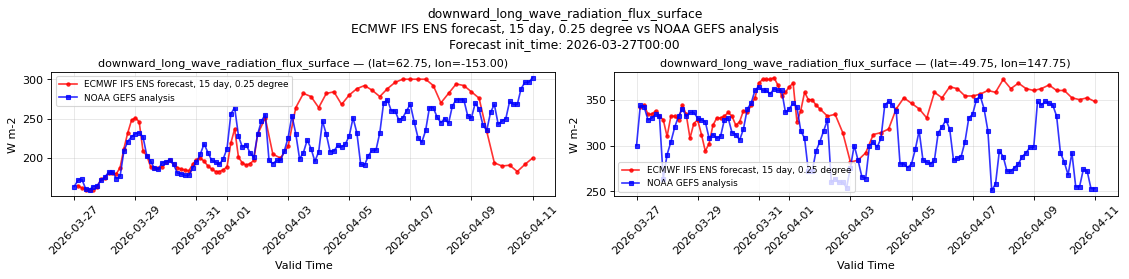
Temporal comparison
- plot:
temporal_downward_long_wave_radiation_flux_surface.png - period: Forecast init_time: 2026-03-27T00:00
P1 (lat=62.75, lon=-153.00):
- validation: min=159, mean=222.2, max=300
- reference: min=160, mean=223.1, max=302
P2 (lat=-49.75, lon=147.75):
- validation: min=282, mean=341.1, max=374
- reference: min=251, mean=308.7, max=364
Nulls
- P1 nulls: 0/3320100 — none
- P2 nulls: 0/3320100 — none

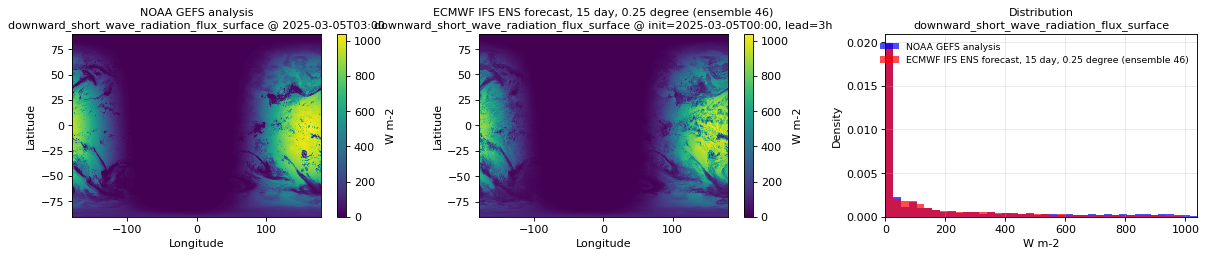
downward_short_wave_radiation_flux_surface
Metadata
- units:
W m-2 - long_name: Surface downward short-wave radiation flux
- short_name: sdswrf
- standard_name: surface_downwelling_shortwave_flux_in_air
- step_type: avg
Spatial comparison
- plot:
spatial_downward_short_wave_radiation_flux_surface.png - time: init=2025-03-05T00:00, lead=3h (reference at 2025-03-05T03:00)
- validation: min=0, mean=146.4, max=1032
- reference: min=0, mean=164.7, max=1040
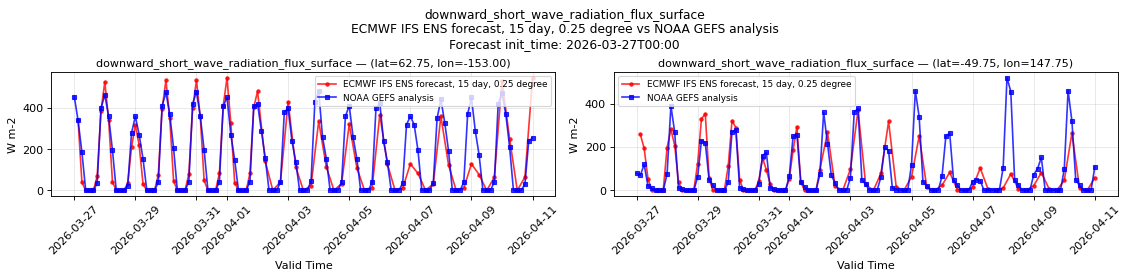
Temporal comparison
- plot:
temporal_downward_short_wave_radiation_flux_surface.png - period: Forecast init_time: 2026-03-27T00:00
P1 (lat=62.75, lon=-153.00):
- validation: min=0, mean=147.1, max=548
- reference: min=0, mean=166.5, max=484
P2 (lat=-49.75, lon=147.75):
- validation: min=0, mean=73.85, max=370
- reference: min=0, mean=79.73, max=520
Nulls
- P1 nulls: 0/3320100 — none
- P2 nulls: 0/3320100 — none

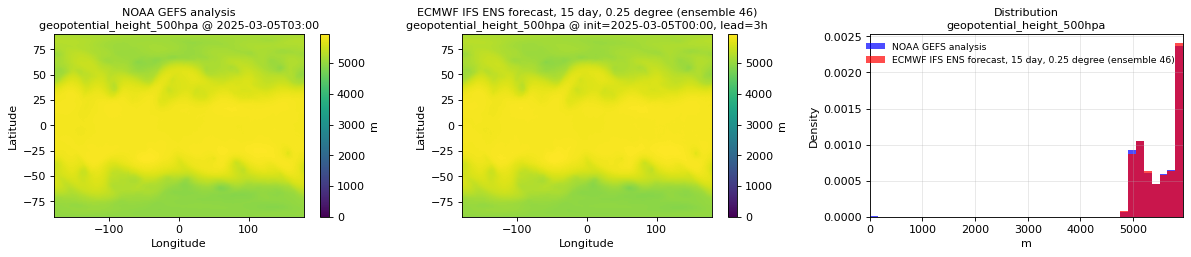
geopotential_height_500hpa
Metadata
- units:
m - long_name: Geopotential height
- short_name: gh
- standard_name: geopotential_height
- step_type: instant
Spatial comparison
- plot:
spatial_geopotential_height_500hpa.png - time: init=2025-03-05T00:00, lead=3h (reference at 2025-03-05T03:00)
- validation: min=4816, mean=5502, max=5950
- reference: min=0, mean=5493, max=5942
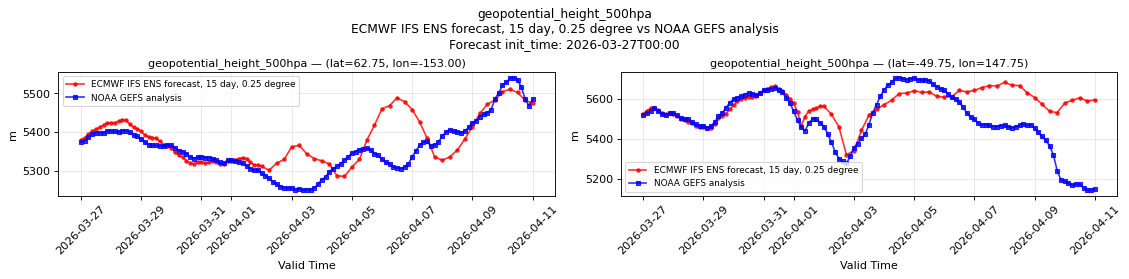
Temporal comparison
- plot:
temporal_geopotential_height_500hpa.png - period: Forecast init_time: 2026-03-27T00:00
P1 (lat=62.75, lon=-153.00):
- validation: min=5286, mean=5377, max=5510
- reference: min=5250, mean=5360, max=5540
P2 (lat=-49.75, lon=147.75):
- validation: min=5320, mean=5566, max=5684
- reference: min=5140, mean=5497, max=5708
Nulls
- P1 nulls: 0/3359625 — none
- P2 nulls: 0/3359625 — none

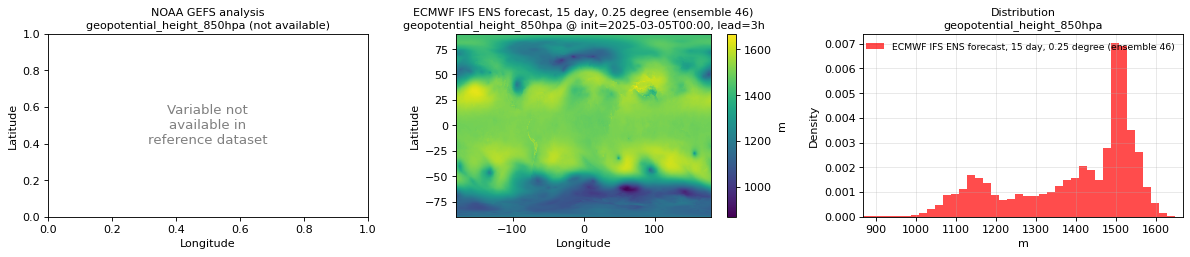
geopotential_height_850hpa
Metadata
- units:
m - long_name: Geopotential height
- short_name: gh
- standard_name: geopotential_height
- step_type: instant
Spatial comparison
- plot:
spatial_geopotential_height_850hpa.png - time: init=2025-03-05T00:00, lead=3h (reference at 2025-03-05T03:00)
- validation: min=868.2, mean=1396, max=1668
- reference: variable not available in reference dataset
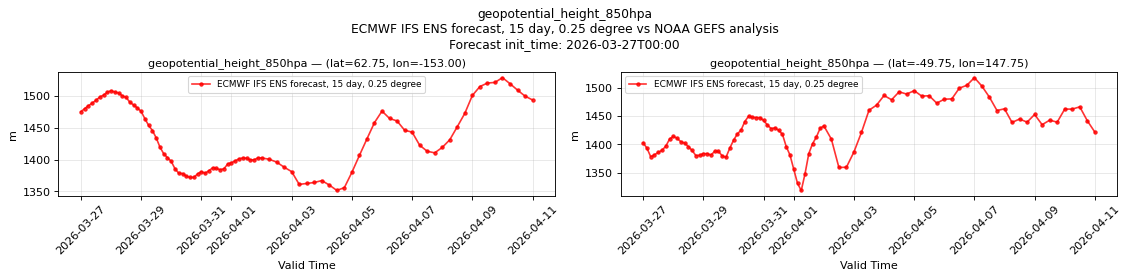
Temporal comparison
- plot:
temporal_geopotential_height_850hpa.png - period: Forecast init_time: 2026-03-27T00:00
P1 (lat=62.75, lon=-153.00):
- validation: min=1352, mean=1433, max=1528
- reference: variable not available in reference dataset
P2 (lat=-49.75, lon=147.75):
- validation: min=1318, mean=1425, max=1518
- reference: variable not available in reference dataset
Nulls
- P1 nulls: 0/3359625 — none
- P2 nulls: 0/3359625 — none

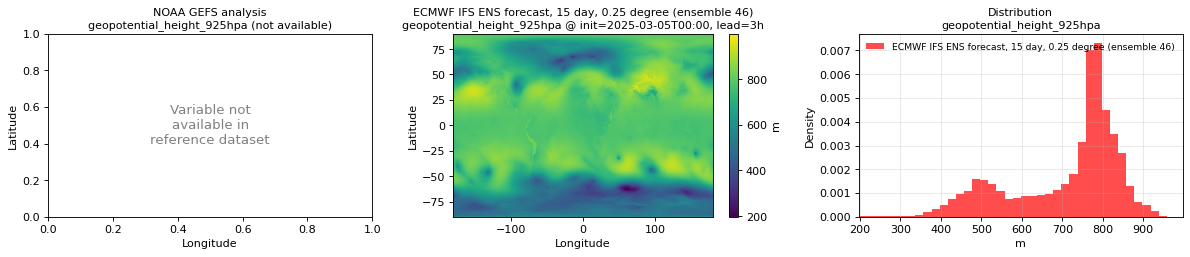
geopotential_height_925hpa
Metadata
- units:
m - long_name: Geopotential height
- short_name: gh
- standard_name: geopotential_height
- step_type: instant
Spatial comparison
- plot:
spatial_geopotential_height_925hpa.png - time: init=2025-03-05T00:00, lead=3h (reference at 2025-03-05T03:00)
- validation: min=197.1, mean=711.7, max=998.2
- reference: variable not available in reference dataset
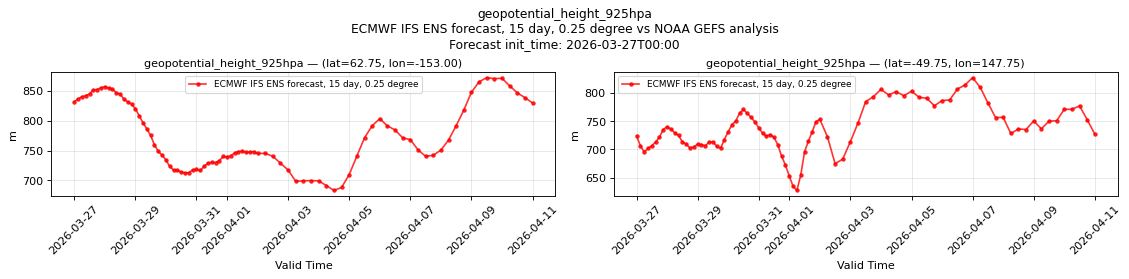
Temporal comparison
- plot:
temporal_geopotential_height_925hpa.png - period: Forecast init_time: 2026-03-27T00:00
P1 (lat=62.75, lon=-153.00):
- validation: min=683, mean=774.2, max=872.2
- reference: variable not available in reference dataset
P2 (lat=-49.75, lon=147.75):
- validation: min=627.5, mean=737.5, max=827
- reference: variable not available in reference dataset
Nulls
- P1 nulls: 0/3359625 — none
- P2 nulls: 0/3359625 — none

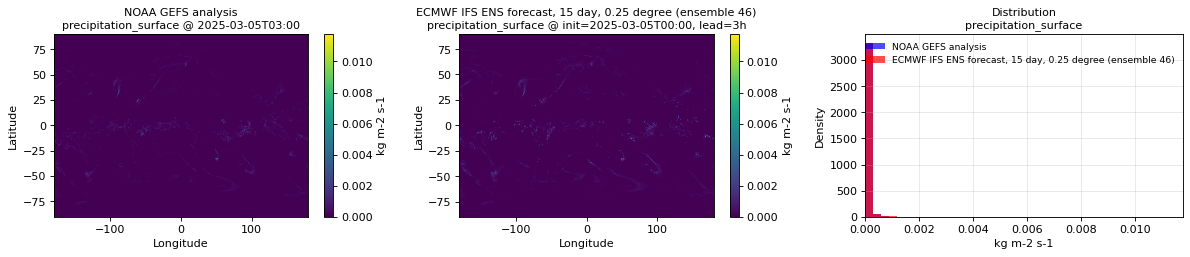
precipitation_surface
Metadata
- units:
kg m-2 s-1 - long_name: Precipitation rate
- short_name: prate
- standard_name: precipitation_flux
- step_type: avg
Spatial comparison
- plot:
spatial_precipitation_surface.png - time: init=2025-03-05T00:00, lead=3h (reference at 2025-03-05T03:00)
- validation: min=0, mean=3.448e-05, max=0.01178
- reference: min=0, mean=2.467e-05, max=0.006256
Temporal comparison
- plot:
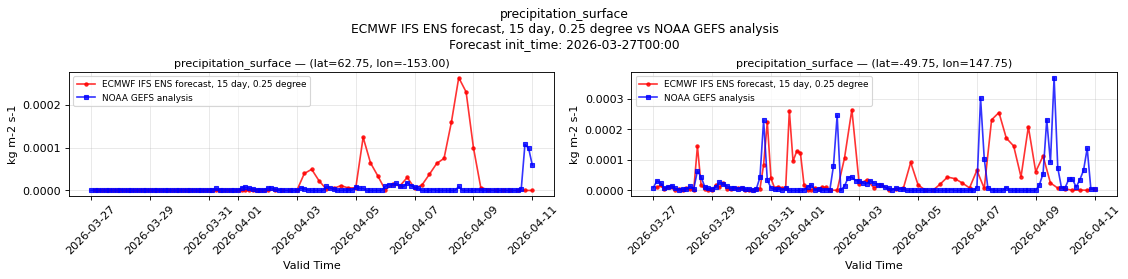
temporal_precipitation_surface.png - period: Forecast init_time: 2026-03-27T00:00
P1 (lat=62.75, lon=-153.00):
- validation: min=0, mean=1.645e-05, max=0.0002632
- reference: min=0, mean=4.131e-06, max=0.0001073
P2 (lat=-49.75, lon=147.75):
- validation: min=0, mean=4.123e-05, max=0.0002651
- reference: min=0, mean=2.53e-05, max=0.00037
Nulls
- P1 nulls: 0/3320100 — none
- P2 nulls: 0/3320100 — none
pressure_reduced_to_mean_sea_level
Metadata
- units:
Pa - long_name: Pressure reduced to MSL
- short_name: prmsl
- standard_name: air_pressure_at_mean_sea_level
- step_type: instant
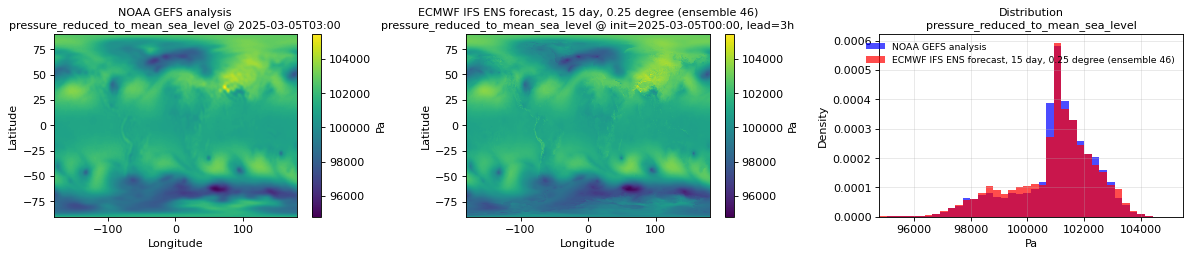
Spatial comparison
- plot:
spatial_pressure_reduced_to_mean_sea_level.png - time: init=2025-03-05T00:00, lead=3h (reference at 2025-03-05T03:00)
- validation: min=9.478e+04, mean=1.009e+05, max=1.052e+05
- reference: min=9.491e+04, mean=1.01e+05, max=1.055e+05
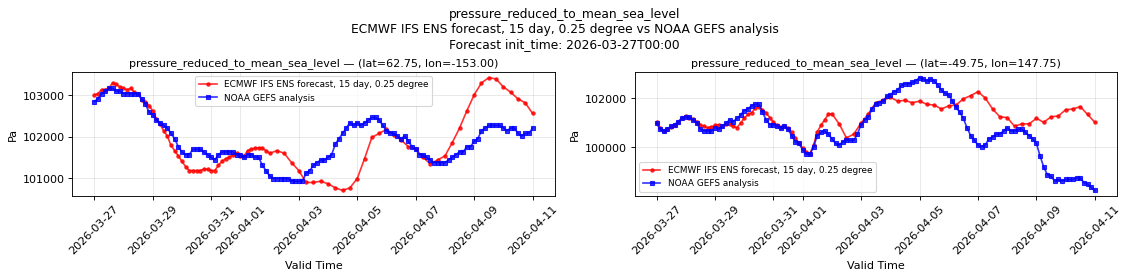
Temporal comparison
- plot:
temporal_pressure_reduced_to_mean_sea_level.png - period: Forecast init_time: 2026-03-27T00:00
P1 (lat=62.75, lon=-153.00):
- validation: min=1.007e+05, mean=1.02e+05, max=1.034e+05
- reference: min=1.009e+05, mean=1.019e+05, max=1.032e+05
P2 (lat=-49.75, lon=147.75):
- validation: min=9.974e+04, mean=1.011e+05, max=1.023e+05
- reference: min=9.824e+04, mean=1.008e+05, max=1.028e+05
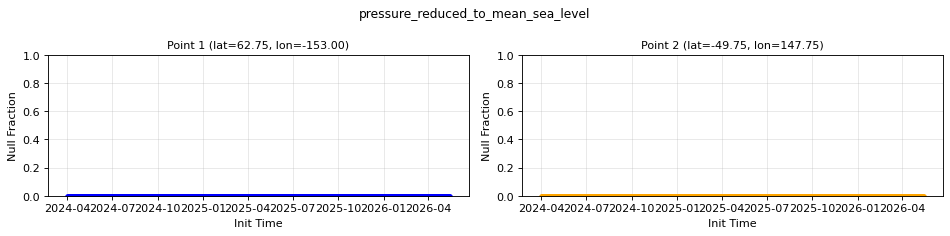
Nulls
- P1 nulls: 0/3359625 — none
- P2 nulls: 0/3359625 — none
pressure_surface
Metadata
- units:
Pa - long_name: Surface pressure
- short_name: sp
- standard_name: surface_air_pressure
- step_type: instant
Spatial comparison
- plot:
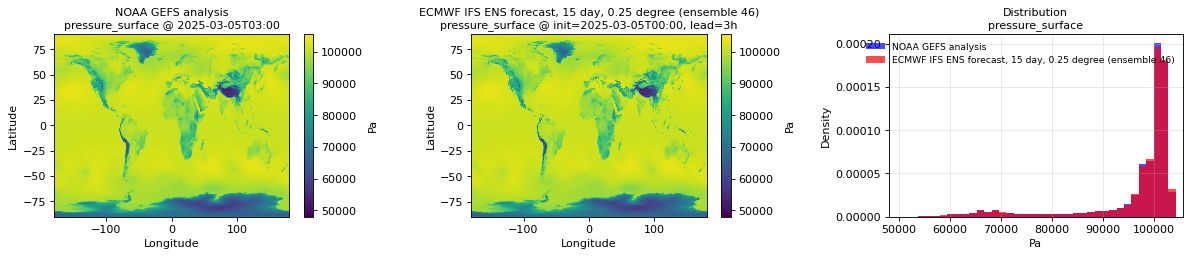
spatial_pressure_surface.png - time: init=2025-03-05T00:00, lead=3h (reference at 2025-03-05T03:00)
- validation: min=4.795e+04, mean=9.665e+04, max=1.057e+05
- reference: min=4.931e+04, mean=9.663e+04, max=1.048e+05
Temporal comparison
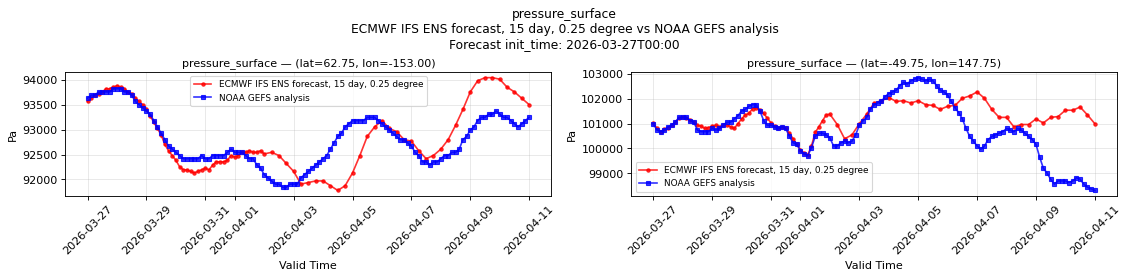
- plot:
temporal_pressure_surface.png - period: Forecast init_time: 2026-03-27T00:00
P1 (lat=62.75, lon=-153.00):
- validation: min=9.178e+04, mean=9.287e+04, max=9.405e+04
- reference: min=9.184e+04, mean=9.281e+04, max=9.382e+04
P2 (lat=-49.75, lon=147.75):
- validation: min=9.974e+04, mean=1.011e+05, max=1.023e+05
- reference: min=9.83e+04, mean=1.008e+05, max=1.028e+05
Nulls
- P1 nulls: 0/3359625 — none
- P2 nulls: 0/3359625 — none

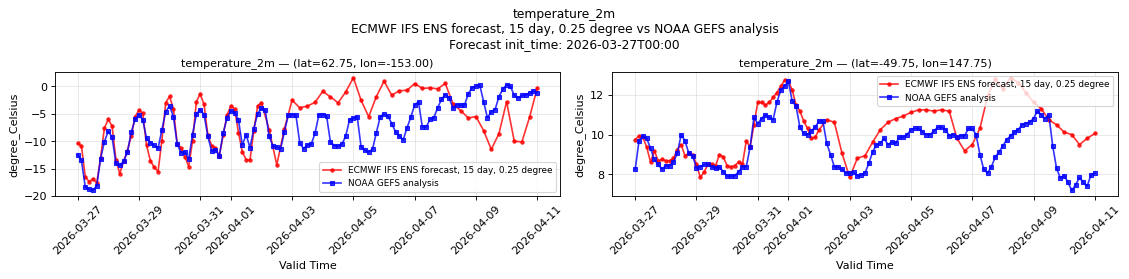
temperature_2m
Metadata
- units:
degree_Celsius - long_name: 2 metre temperature
- short_name: 2t
- standard_name: air_temperature
- step_type: instant
Spatial comparison
- plot:
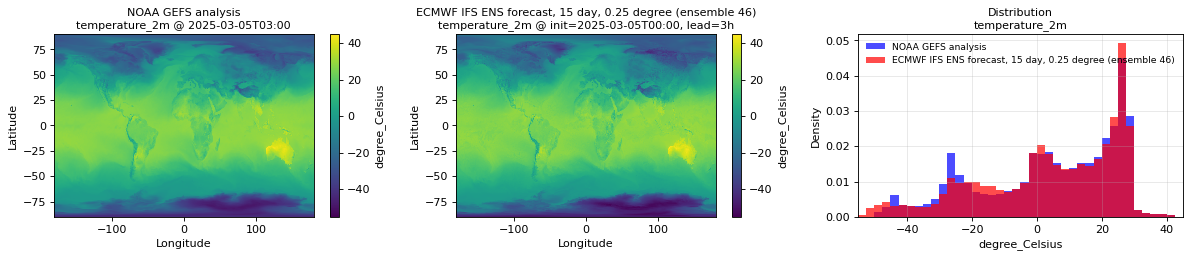
spatial_temperature_2m.png - time: init=2025-03-05T00:00, lead=3h (reference at 2025-03-05T03:00)
- validation: min=-55.25, mean=4.067, max=45
- reference: min=-49.75, mean=3.908, max=44.5
Temporal comparison
- plot:
temporal_temperature_2m.png - period: Forecast init_time: 2026-03-27T00:00
P1 (lat=62.75, lon=-153.00):
- validation: min=-17.62, mean=-7.116, max=1.609
- reference: min=-19, mean=-7.348, max=0.3164
P2 (lat=-49.75, lon=147.75):
- validation: min=7.844, mean=10.15, max=12.88
- reference: min=7.188, mean=9.426, max=12.69
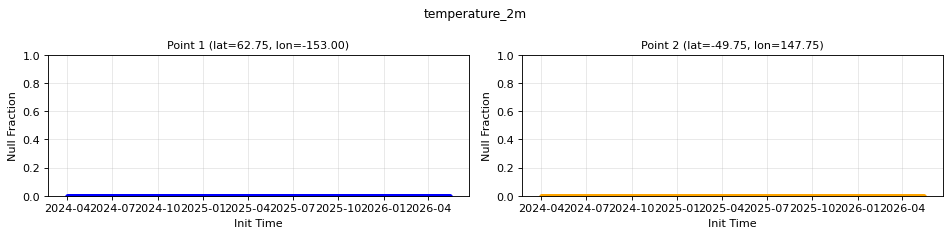
Nulls
- P1 nulls: 0/3359625 — none
- P2 nulls: 0/3359625 — none
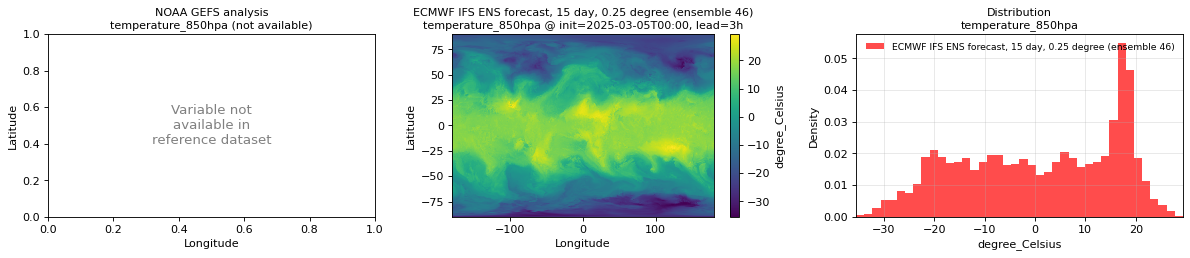
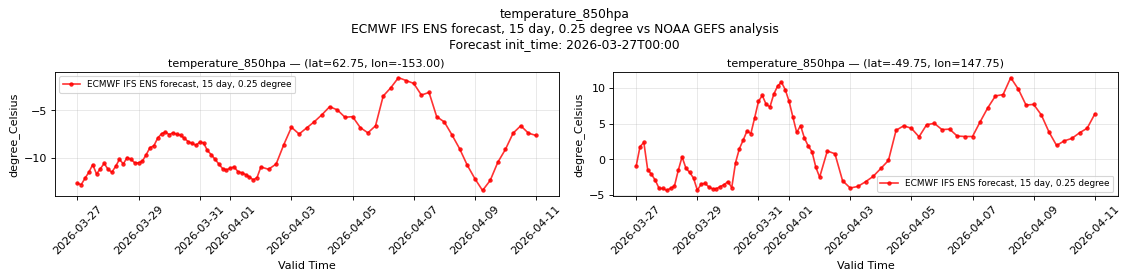
temperature_850hpa
Metadata
- units:
degree_Celsius - long_name: Temperature
- short_name: t
- standard_name: air_temperature
- step_type: instant
Spatial comparison
- plot:
spatial_temperature_850hpa.png - time: init=2025-03-05T00:00, lead=3h (reference at 2025-03-05T03:00)
- validation: min=-35.5, mean=0.7232, max=29.38
- reference: variable not available in reference dataset
Temporal comparison
- plot:
temporal_temperature_850hpa.png - period: Forecast init_time: 2026-03-27T00:00
P1 (lat=62.75, lon=-153.00):
- validation: min=-13.5, mean=-8.783, max=-1.508
- reference: variable not available in reference dataset
P2 (lat=-49.75, lon=147.75):
- validation: min=-4.375, mean=2.027, max=11.44
- reference: variable not available in reference dataset
Nulls
- P1 nulls: 0/3359625 — none
- P2 nulls: 0/3359625 — none

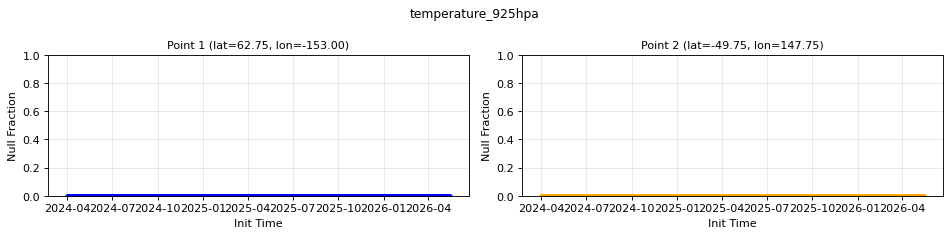
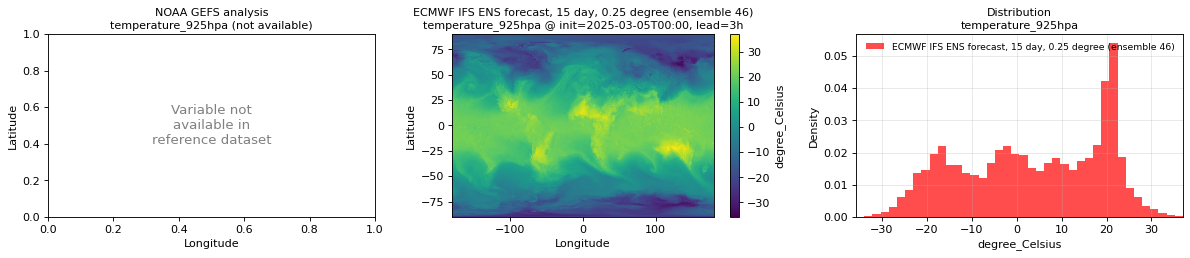
temperature_925hpa
Metadata
- units:
degree_Celsius - long_name: Temperature
- short_name: t
- standard_name: air_temperature
- step_type: instant
Spatial comparison
- plot:
spatial_temperature_925hpa.png - time: init=2025-03-05T00:00, lead=3h (reference at 2025-03-05T03:00)
- validation: min=-35.75, mean=3.502, max=37
- reference: variable not available in reference dataset
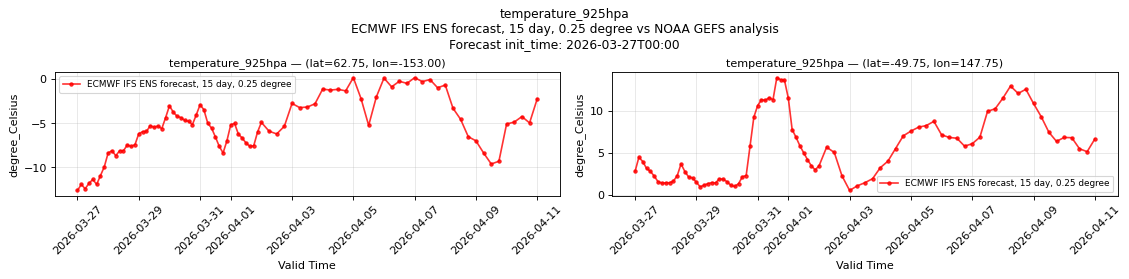
Temporal comparison
- plot:
temporal_temperature_925hpa.png - period: Forecast init_time: 2026-03-27T00:00
P1 (lat=62.75, lon=-153.00):
- validation: min=-12.62, mean=-5.357, max=0.1611
- reference: variable not available in reference dataset
P2 (lat=-49.75, lon=147.75):
- validation: min=0.5547, mean=5.524, max=13.94
- reference: variable not available in reference dataset
Nulls
- P1 nulls: 0/3359625 — none
- P2 nulls: 0/3359625 — none
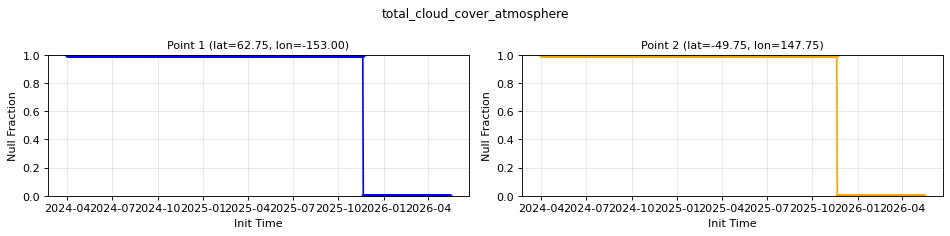
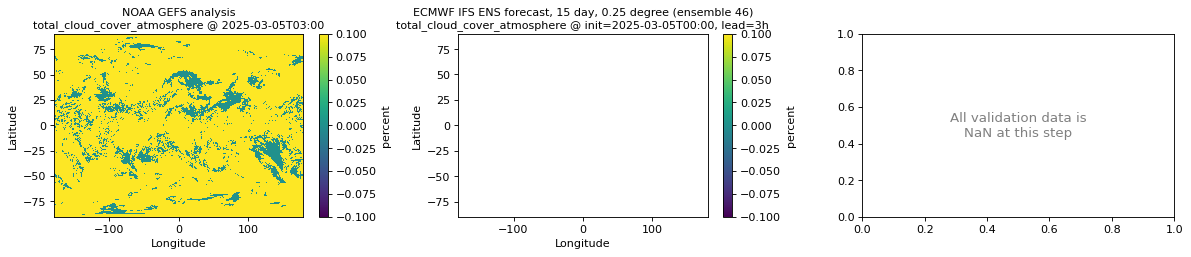
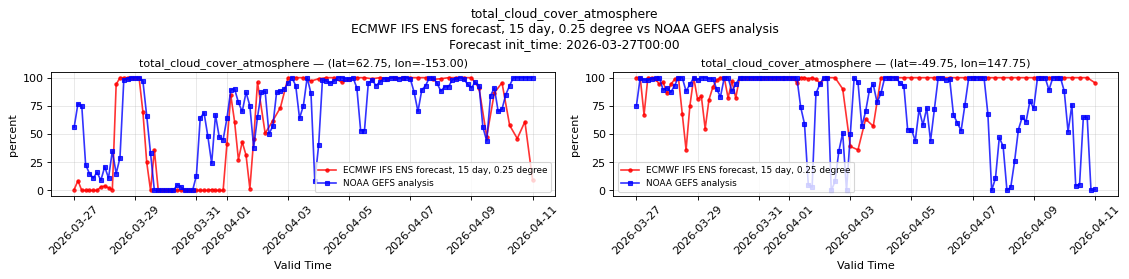
total_cloud_cover_atmosphere
Metadata
- units:
percent - long_name: Total cloud cover
- short_name: tcc
- standard_name: cloud_area_fraction
- step_type: instant
Spatial comparison
- plot:
spatial_total_cloud_cover_atmosphere.png - time: init=2025-03-05T00:00, lead=3h (reference at 2025-03-05T03:00)
- validation: min=NaN, mean=NaN, max=NaN
- reference: min=0, mean=61.92, max=100
Temporal comparison
- plot:
temporal_total_cloud_cover_atmosphere.png - period: Forecast init_time: 2026-03-27T00:00
P1 (lat=62.75, lon=-153.00):
- validation: min=0, mean=52.28, max=100
- reference: min=0, mean=69.97, max=100
P2 (lat=-49.75, lon=147.75):
- validation: min=36, mean=93.32, max=100
- reference: min=0, mean=76.7, max=100
Nulls
- P1 nulls: 2596665/3359625 — 599 missing (first: 2024-04-01T00:00:00, 2024-04-02T00:00:00, 2024-04-03T00:00:00 … last: 2025-11-18T00:00:00, 2025-11-19T00:00:00, 2025-11-20T00:00:00)
- P2 nulls: 2596665/3359625 — 599 missing (first: 2024-04-01T00:00:00, 2024-04-02T00:00:00, 2024-04-03T00:00:00 … last: 2025-11-18T00:00:00, 2025-11-19T00:00:00, 2025-11-20T00:00:00)
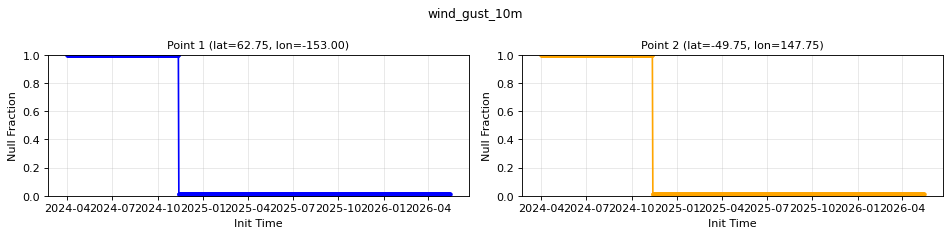
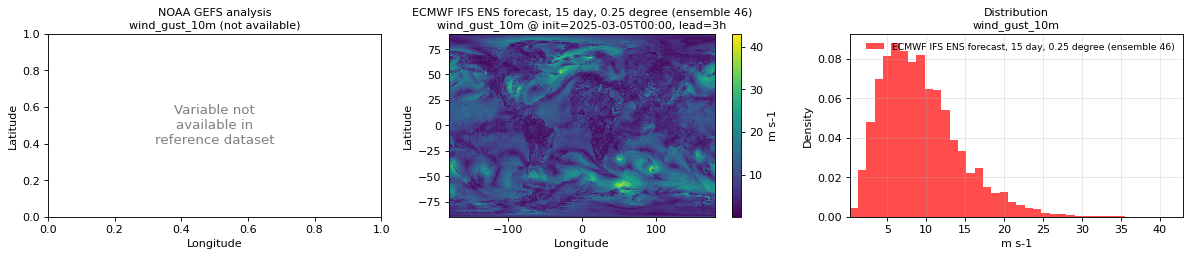
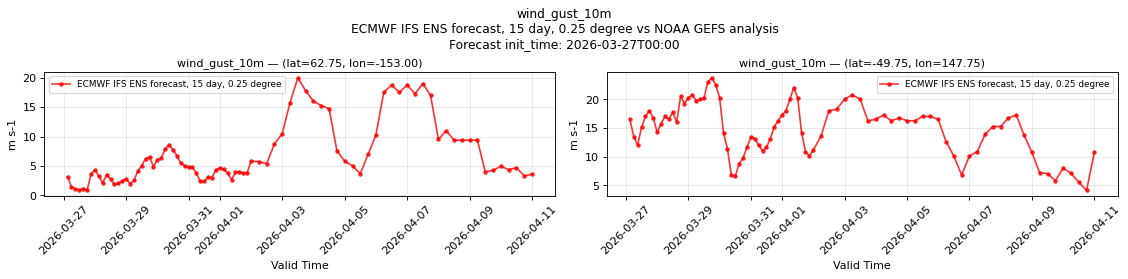
wind_gust_10m
Metadata
- units:
m s-1 - long_name: Maximum 10 metre wind gust since previous post-processing
- short_name: 10fg
- standard_name: wind_speed_of_gust
- step_type: max
Spatial comparison
- plot:
spatial_wind_gust_10m.png - time: init=2025-03-05T00:00, lead=3h (reference at 2025-03-05T03:00)
- validation: min=0.1621, mean=9.342, max=43
- reference: variable not available in reference dataset
Temporal comparison
- plot:
temporal_wind_gust_10m.png - period: Forecast init_time: 2026-03-27T00:00
P1 (lat=62.75, lon=-153.00):
- validation: min=0.8359, mean=6.787, max=20
- reference: variable not available in reference dataset
P2 (lat=-49.75, lon=147.75):
- validation: min=4.125, mean=14.77, max=23.75
- reference: variable not available in reference dataset
Nulls
- P1 nulls: 968184/3320100 — 226 missing (first: 2024-04-01T00:00:00, 2024-04-02T00:00:00, 2024-04-03T00:00:00 … last: 2024-11-10T00:00:00, 2024-11-11T00:00:00, 2024-11-12T00:00:00)
- P2 nulls: 968184/3320100 — 226 missing (first: 2024-04-01T00:00:00, 2024-04-02T00:00:00, 2024-04-03T00:00:00 … last: 2024-11-10T00:00:00, 2024-11-11T00:00:00, 2024-11-12T00:00:00)
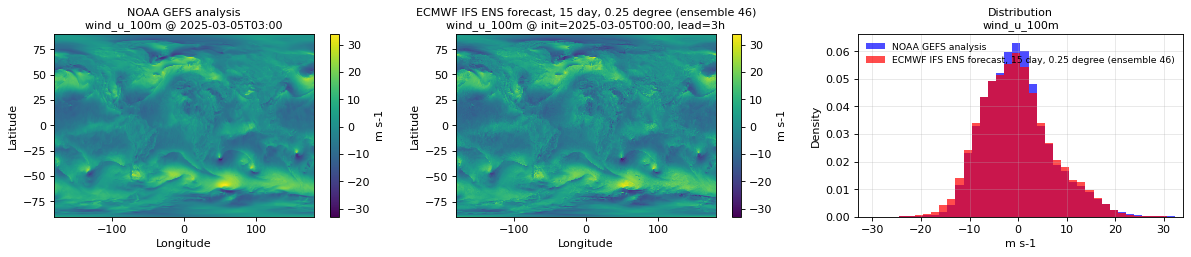
wind_u_100m
Metadata
- units:
m s-1 - long_name: 100 metre U wind component
- short_name: 100u
- standard_name: eastward_wind
- step_type: instant
Spatial comparison
- plot:
spatial_wind_u_100m.png - time: init=2025-03-05T00:00, lead=3h (reference at 2025-03-05T03:00)
- validation: min=-33, mean=-0.3196, max=32.5
- reference: min=-30.75, mean=-0.1359, max=34
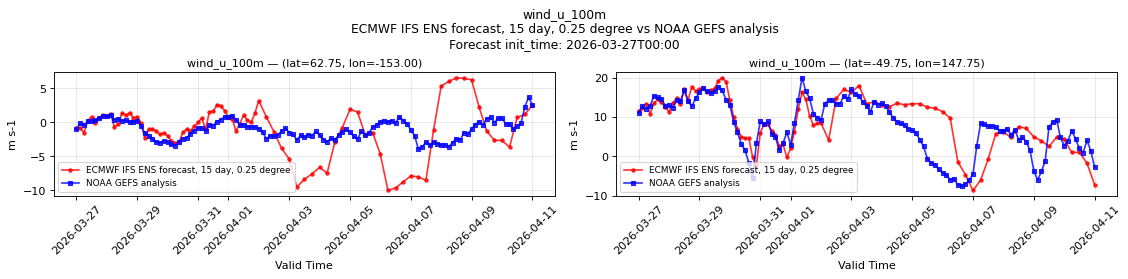
Temporal comparison
- plot:
temporal_wind_u_100m.png - period: Forecast init_time: 2026-03-27T00:00
P1 (lat=62.75, lon=-153.00):
- validation: min=-10, mean=-1.027, max=6.562
- reference: min=-3.906, mean=-1.043, max=3.719
P2 (lat=-49.75, lon=147.75):
- validation: min=-8.625, mean=9.172, max=20
- reference: min=-7.5, mean=7.534, max=20
Nulls
- P1 nulls: 0/3359625 — none
- P2 nulls: 0/3359625 — none

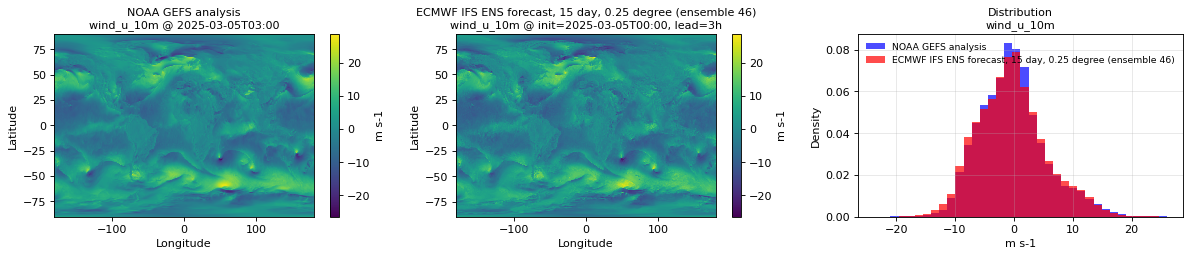
wind_u_10m
Metadata
- units:
m s-1 - long_name: 10 metre U wind component
- short_name: 10u
- standard_name: eastward_wind
- step_type: instant
Spatial comparison
- plot:
spatial_wind_u_10m.png - time: init=2025-03-05T00:00, lead=3h (reference at 2025-03-05T03:00)
- validation: min=-26.5, mean=-0.312, max=28.75
- reference: min=-26, mean=-0.1602, max=27.5
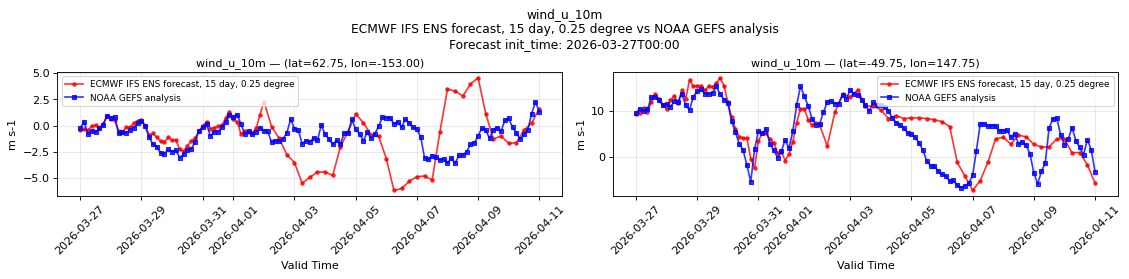
Temporal comparison
- plot:
temporal_wind_u_10m.png - period: Forecast init_time: 2026-03-27T00:00
P1 (lat=62.75, lon=-153.00):
- validation: min=-6.188, mean=-0.8472, max=4.562
- reference: min=-3.594, mean=-0.8461, max=2.25
P2 (lat=-49.75, lon=147.75):
- validation: min=-7.25, mean=7.196, max=17.25
- reference: min=-6.625, mean=6.148, max=15.38
Nulls
- P1 nulls: 0/3359625 — none
- P2 nulls: 0/3359625 — none

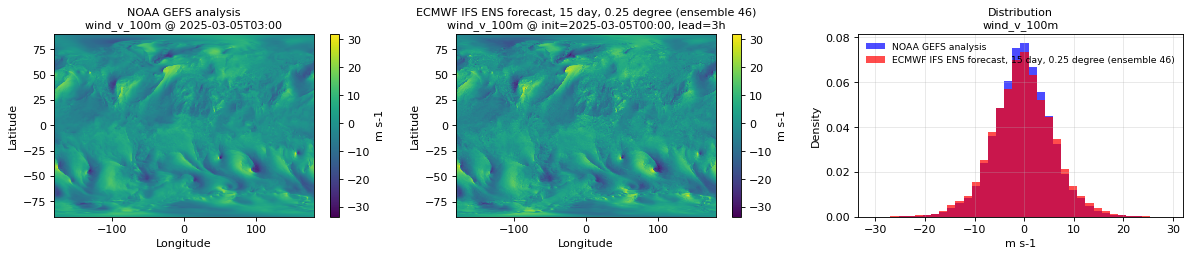
wind_v_100m
Metadata
- units:
m s-1 - long_name: 100 metre V wind component
- short_name: 100v
- standard_name: northward_wind
- step_type: instant
Spatial comparison
- plot:
spatial_wind_v_100m.png - time: init=2025-03-05T00:00, lead=3h (reference at 2025-03-05T03:00)
- validation: min=-33.5, mean=-0.1796, max=32
- reference: min=-33, mean=-0.2466, max=30.25
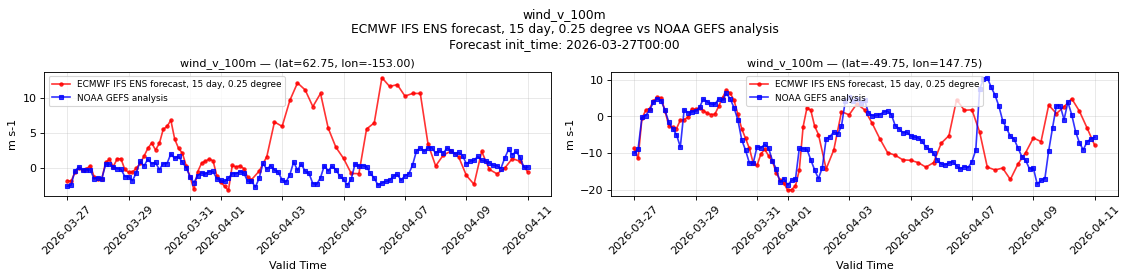
Temporal comparison
- plot:
temporal_wind_v_100m.png - period: Forecast init_time: 2026-03-27T00:00
P1 (lat=62.75, lon=-153.00):
- validation: min=-3.188, mean=2.225, max=12.88
- reference: min=-2.719, mean=-0.07724, max=2.906
P2 (lat=-49.75, lon=147.75):
- validation: min=-20.25, mean=-4.746, max=7.188
- reference: min=-18.75, mean=-4.727, max=10.62
Nulls
- P1 nulls: 0/3359625 — none
- P2 nulls: 0/3359625 — none

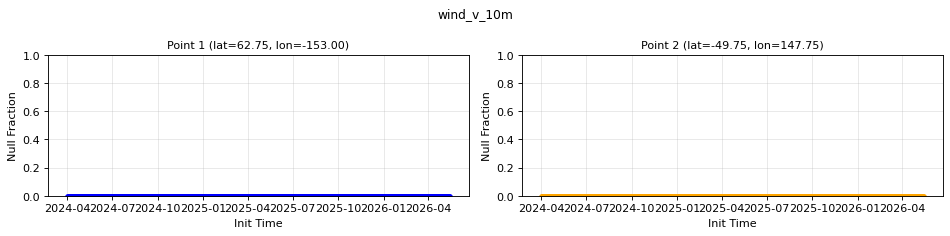
wind_v_10m
Metadata
- units:
m s-1 - long_name: 10 metre V wind component
- short_name: 10v
- standard_name: northward_wind
- step_type: instant
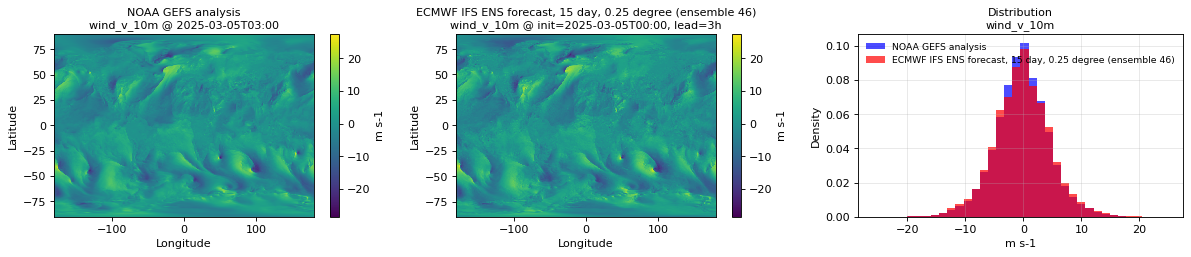
Spatial comparison
- plot:
spatial_wind_v_10m.png - time: init=2025-03-05T00:00, lead=3h (reference at 2025-03-05T03:00)
- validation: min=-28.5, mean=-0.1665, max=27.5
- reference: min=-27.25, mean=-0.2112, max=25.75
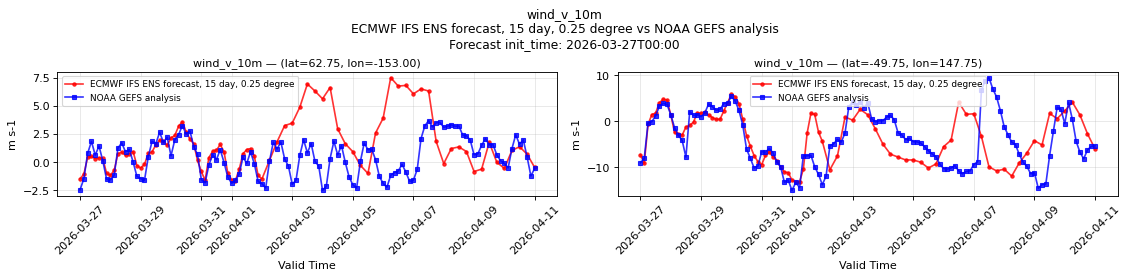
Temporal comparison
- plot:
temporal_wind_v_10m.png - period: Forecast init_time: 2026-03-27T00:00
P1 (lat=62.75, lon=-153.00):
- validation: min=-1.625, mean=1.439, max=7.5
- reference: min=-2.5, mean=0.4872, max=3.688
P2 (lat=-49.75, lon=147.75):
- validation: min=-13.25, mean=-3.311, max=5.875
- reference: min=-15, mean=-3.782, max=9.5
Nulls
- P1 nulls: 0/3359625 — none
- P2 nulls: 0/3359625 — none